
Today’s Business Aviation Market – Heightened Adversity through Structural Change
For marketers, studying change is an integral exercise to the art and science of practicing marketing. Recognizing change in our chosen market, evaluating its impact, and using it to advantage to promote a product or service is how to stay ahead of competitors; we submit that the ability to do this is both more difficult, and more important, in today’s business aviation market.
The Great Recession of 2008-2009: A Paradigm Shift for Business Aviation
We think many in the industry have not yet recognized nor accepted that the Great Recession was most definitely about change, a real “shift” marker for the business aviation market. We believe it was.
Every week, we read stories from Wall Street analysts and industry reporters that make comparisons between today’s results and the “peak” of activity prior to the recession. It’s as though that peak level of activity is the norm and the industry is somehow underperforming until it once again achieves that high level. We think it unlikely the industry will see a return of the “peak” within the next ten years – a virtual lifetime for people who come to work every day with the responsibility of marketing and selling business aircraft and all the attendant products and services that make up the industry.
Our belief in the permanence of this change is based on looking at key drivers of the business aviation market and comparing how business was conducted pre-2008 with how it is conducted now. In this first section of this book we examine what we’ve come to informally refer to as the “too littles/too manys”:
- Availability of Credit – Chapter 1 (too little credit)
- Used Aircraft Inventory, and Pricing – Chapter 2 (too many used aircraft for sale)
- Aircraft Utilization – Chapter 3 (too little aircraft utilization)
- New Aircraft Sales – Chapter 4 (too many new aircraft models for sale)
- A Major Shift in Demand -Chapter 5 (too many bets placed in the wrong places)
The takeaway? Combined, these factors suggest a structural change in the business aviation-marketing environment that will take some time for the industry to adapt to, thereby increasing the adversity faced by those trying to make this adjustment.
We address these topics in the following pages, realizing that the scope is large and the interaction across these issues is also a factor. Chapter 1 (“Aircraft Financing – Skin in the Game”) will get us started.
Chapter 1 – The Availability of Credit and Aircraft Financing: Skin in the Game
A little historical perspective may help here, especially if you are new to business aviation marketing. In the good old days, i.e. pre-2008, life was good and aircraft sales and services continued on a steady and seemingly endless upswing. Back then, you could purchase almost any business turboprop or jet by simply using the asset as collateral. There was little or no down payment required as long as the aircraft was in demand and the purchaser had a reasonable record of fiscal stability.
Why was this? Because history had taught lenders that turbine powered business aircraft held their value. It was the norm that five or seven years after purchase of a new aircraft – especially a high-end jet – the asset could often fetch close to its original price and sometimes even a premium. Consequently, business aircraft were low risk loans.
Keep in mind that business jets only started to appear in the mid-1960s and initially were delivered at a very slow pace. So, inventories of “used” jets were low and moved quickly on- and off-market. By the late 1990s and early 2000s, business jets and turboprops had become an accepted means of business travel especially in the USA and Europe. Deliveries increased and inventories of used turbine aircraft gradually followed suit. Additionally, more and more manufacturers entered the turbine business aircraft market. There were early warning signs along the way of impending market change such as during the collapse of the technology bubble, but not significant enough to alter the status quo of production and service.
And then, at the peak of jet deliveries in 2008, the western world went into a major recession and the business aviation market went along for the slide.
The recession was spurred by a non-aviation event, i.e. the sub-prime mortgage meltdown in the USA (and similar crises in Europe). And like most such events there were unintended, or perhaps more accurately, ancillary consequences. One of these consequences was for government to take a deep look at the banking industry – and specifically lending practices – not just for real estate but also for the banking industry as a whole. The banks themselves became risk averse. New rules were established and suddenly credit became a very difficult item to obtain even for large creditworthy organizations.
For the business aviation industry post 2008-2009, credit became expensive and cash became king. No longer could someone purchase a business jet with just a smile and a promise to pay. Now financial institutions wanted borrowers to have some “skin in the game”, i.e. share the risk. Buyers would now need at least a 20% down payment and oftentimes much more. Those pre-recession aircraft owners who had marginal credit-worthiness didn’t even bother to apply for loans in this new environment but headed for the nearest airline ticket counter instead.
The result? Since the 2008-2009 timeframe, more than 70% of business jet transactions are conducted via cash, not financing. That’s almost the polar opposite of pre-2008-09 dealings. How times had changed.
Banks had begun to act rationally: why should a multi-million dollar asset, which could quite literally fly away, be given a pass on the rules that guided every other business asset purchase?
The result, of course, was fewer qualified buyers, and a concomitant lessening of demand. Virtually overnight it became that much harder to sell a new airplane.
Chapter 2 – Used Aircraft Inventory and Pricing: The Proof of Permanent Change
While we started our marketing discourse in the last chapter by talking about availability of credit and its effect on the business aviation market, there is obviously much more to the story if we are to conclude that the changes in the business aviation industry are permanent. The factors we’re discussing in this first section – availability of credit, used aircraft inventory, pricing, new sales, utilization, etc. – need to be considered together as they each may have some influence on the others; in other words, these factors very much interact with one another.
One of the most important of these interactive factors is the inventory of used aircraft at any point in time.
Used aircraft inventory is important because it acts as a measure of market conditions. A pre-requisite for most buyers of new aircraft is the assurance that there is an active market for their current aircraft. As inventories of used aircraft increase, it becomes harder for the potential new aircraft buyer to sell their current aircraft due to lack of demand. Consequently, the health of the used aircraft market becomes an indicator of new aircraft sales. Pre-2008, industry observers considered it a rule of thumb that as long as inventories remained at or below historical market averages (about 11-12% of the fleet), the market would be robust. But does that still hold true?
As a percent of the fleet, the worldwide used business jet market as of the end of 2016 is more or less back to its historical average of jets for sale, but the fleet is now larger (about 30% more jets than 2008) and the volume of inventories higher by about 800 jets (roughly a 40% increase (see chart below)). Have the number of buyers increased in proportion? We seriously doubt it. We suspect there may be even fewer buyers than pre-recession.
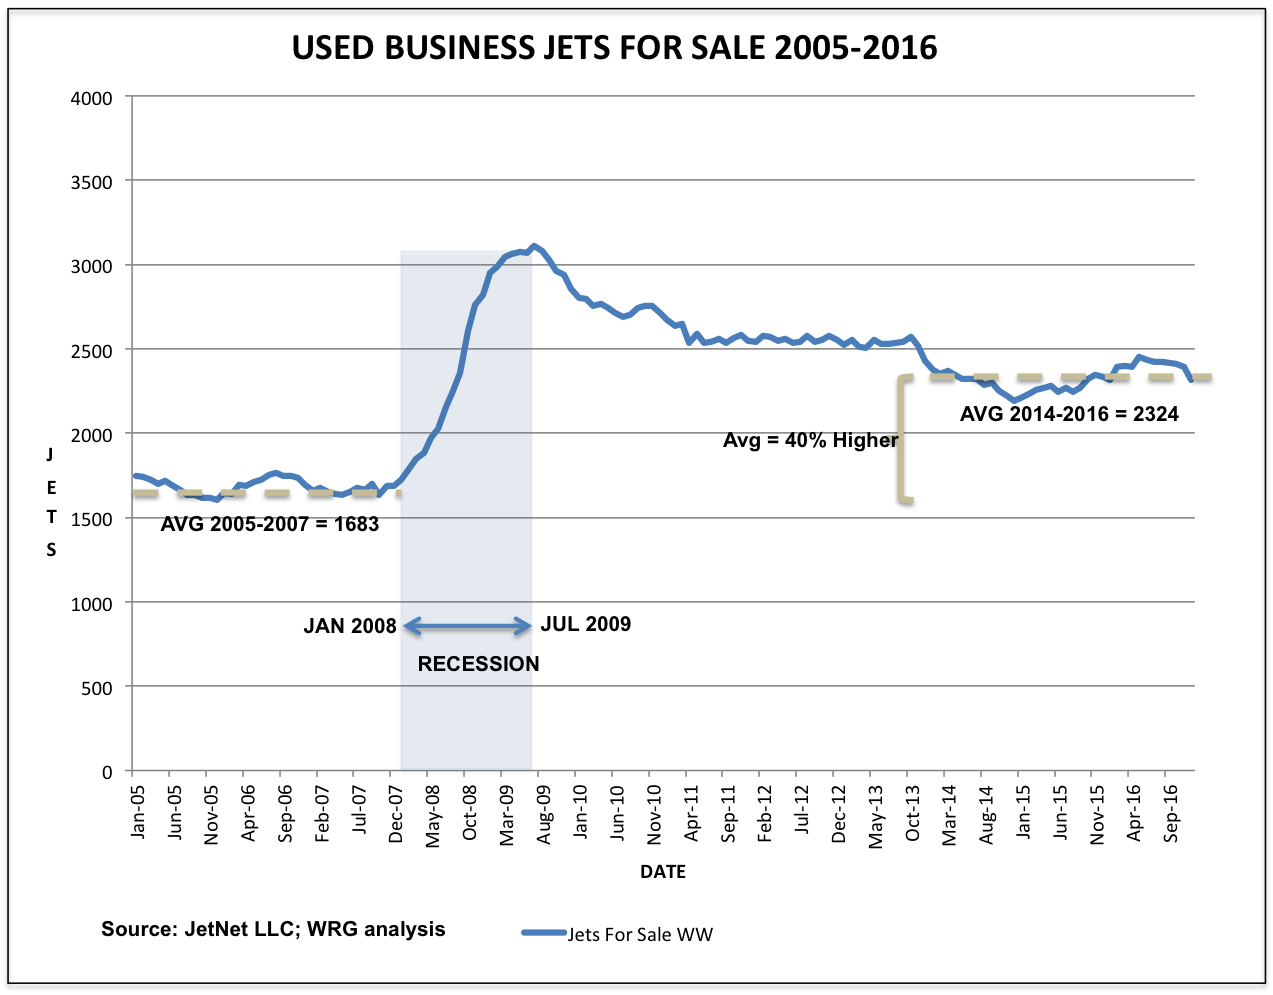
The accompanying chart “Business Jets for Sale 2005-2016” illustrates business jet inventories from January 2005 through December 2016. Notice any trends? A buildup of inventories started around January of 2008 and ramped up quickly to reach a peak in summer 2009. The Great Recession of 2008-2009 was on. A “recovery” appeared to be in process beginning in the fall of 2009 and continued through early 2011 and then market size settled at a significantly higher level than pre-2008. Nevertheless, by 2011industry analysts and forecasters confidently began citing a return to normal inventory levels in their writings and predicting resumed growth of new jet deliveries. Unfortunately, used inventories stalled at what appears to be a “new normal” level.
Marketers need to monitor this metric closely: since about 2012, industry forecasters have found it necessary to continually revise new production forecasts lower. If nothing else, the forecast revisions validate the influence of used inventory on the new production market.
Not surprisingly higher levels of inventory plus our view that buyer volume has not increased to keep pace, puts pressure on pricing. What is significantly different post 2008-09, indeed unprecedented, is the scale of the drop in prices. As of this writing there remains no firm bottom to the price declines in most aircraft categories. We would point once again to credit availability, increased inventory and fewer buyers as reasons for this. Add to this lower utilization rates of aircraft that we will discuss in the next chapter and it has truly become – a buyer’s market.
(We can also link the change in credit rules as a contributor to treating business aircraft much like any other business asset, i.e., the asset is now depreciating more like any other piece of business equipment. We mentioned in the previous chapter about how well turbine aircraft held their value pre-recession, which in effect made them an asset class of their own. But post 2008-2009, aircraft are depreciating about the way you would expect any business asset to depreciate and that is reflected in the pricing. Some examples* using 2008 as the aircraft model year: a Learjet 60XR sells for 28% of original value, a Challenger 605 for 42%, a Gulfstream 450 for 51% and a King Air 200GT for 51%. This rate of depreciation would not have happened pre-2008-2009.)
* Source: Vref Publishing, 2015 Volume 4 Newsletter)
Chapter 3 – New Aircraft Sales and Aircraft Utilization
In the previous chapter, we noted the importance of used aircraft inventory and its potential effect on aircraft pricing. We also alluded to the influence of high inventory levels on new aircraft deliveries. Let’s explore further.
Below is a chart “Business Jet Deliveries 1995-2016” of new business jet deliveries for calendar years 1995 through 2016.
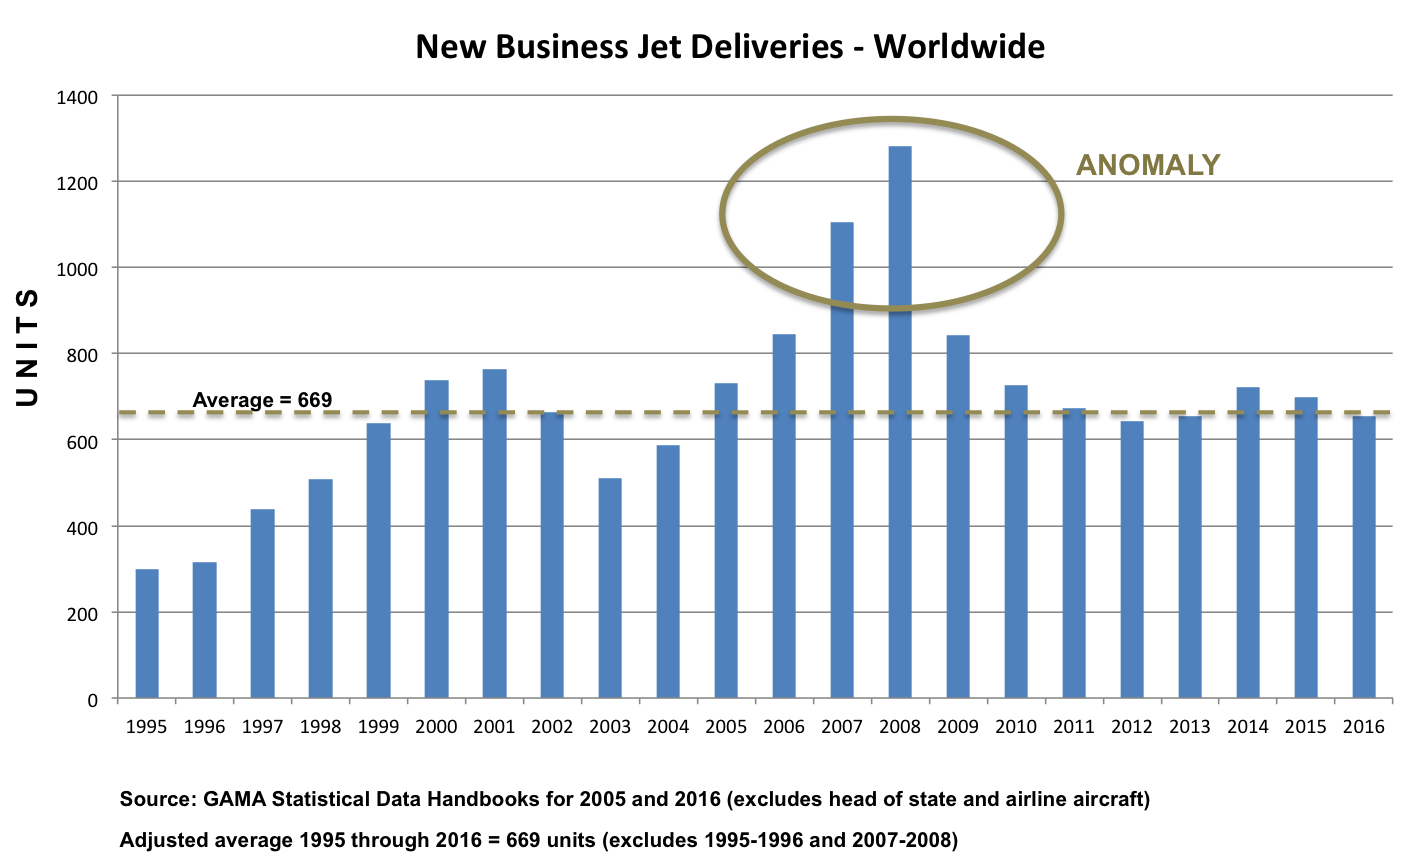
If you notice a familiar pattern, it’s the climb in deliveries through 2008 followed by a rapid fall. Compare this to the Business Jets for Sale 2005-2016 chart in Chapter 2. There is some time lag for used business jet inventory to build, but the relationship appears clear. Inventory has remained relatively flat between 2011 and 2016; so too have new deliveries.
We will not engage in forecasting the next ten years here, as that has proven to be a futile exercise for even the most seasoned of experts, but we will postulate that we do not expect to see the “Peak” numbers recorded in 2007 and 2008 to occur again in the foreseeable future.
New deliveries are also dependent to some degree on flight activity, which has also gone through a dramatic reduction and continues to struggle to recover. The chart below shows a Year-Over-Year (YOY) view of flight activity in the USA and Europe from January 2009 through December 2016.
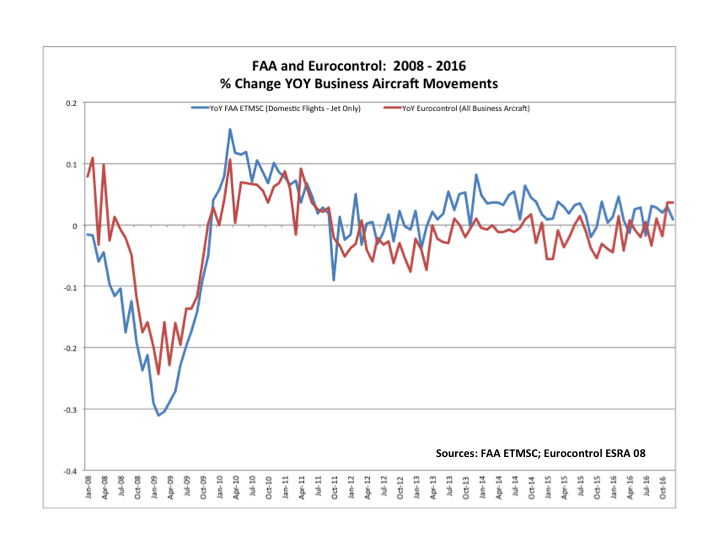
As expected, flight cycles (a cycle is one takeoff and one landing) fell precipitously through 2009 and started a YOY uptick in 2010. Keep in mind these are year-over-year comparisons, so an uptick, while good, just means “as compared with” the prior year. The value of the chart is to show that the USA did not show consistent growth until April of 2013 and even then the growth has been quite modest. The EU has demonstrated little improvement after a brief uptick from December 2009 through September 2011. Since then EU has experienced external events, Russian-Ukrainian confrontations, that have significantly impacted business aviation activity in the region.
The sobering fact is that as of the end of 2016 (7 years after the recovery began), operations in the USA remained about 12% below its 2007 peak; put another way, operations regained less than half of the flight activity given up during the Great Recession of 2008-2009. Recovery in Europe has followed a similar path. When you consider that despite lower delivery numbers the worldwide business jet fleet has grown some 30% since 2008, it means average aircraft utilization has not recovered for the fleet as a whole.
So if a lower overall utilization rate is another damper on sales of new aircraft what might be a reasonable response by OEMs?
For one: the flurry of new product designs currently entering the market is an attempt to create market excitement and a desire to refresh the fleet. But a fear that we have is that there are currently too many new aircraft models for sale, and that with more new models coming on-line this crowded market will only get worse, as the next chapter suggests.
Chapter 4 – New Aircraft Sales: Are There Too Many Models?
To this point, we’ve noted the importance of used aircraft inventory and its effect on pricing, the influence of high used aircraft inventory levels on new aircraft deliveries, and we just discussed the dampening effects of lower utilization rates. With this as background, let’s take a closer look at historical and current levels of new aircraft (business jets) sales and our fear that there are simply too many models of new aircraft for the current and near future market to support.
Let’s revisit our business jet deliveries chart from Chapter 3 illustrating deliveries for calendar years 1995 through 2016.
A quick look at the chart above and we can readily see that deliveries for 2007 and 2008 appear to be an anomaly. If we remove those two years and for the sake of balance remove the two low years of 1995-1996, we can compute a simple industry average number of deliveries to equal 669. And indeed there are quite a few years where deliveries hover around that number.
This doesn’t mean that there is no possibility for growth in deliveries going forward and that the average cannot rise. It just means that there’s a need to pay attention to the relationship between the two segments – new and used – and to be wary of future rapid buildups in production.
The overhang of used aircraft we have addressed thus far and the downward pressure it has exerted on aircraft pricing makes even the current level of production (in 2016 terms) suspect especially when we consider the number of models available.
The table below lists the 2017 models of business turboprops and jets being manufactured (excludes utility aircraft). Note there are approximately 40 different models of business jets being offered for a market demand of 661 aircraft (2016 deliveries including VVIP jets). This equates to roughly 17 units per model (assumes all models have equal sales).
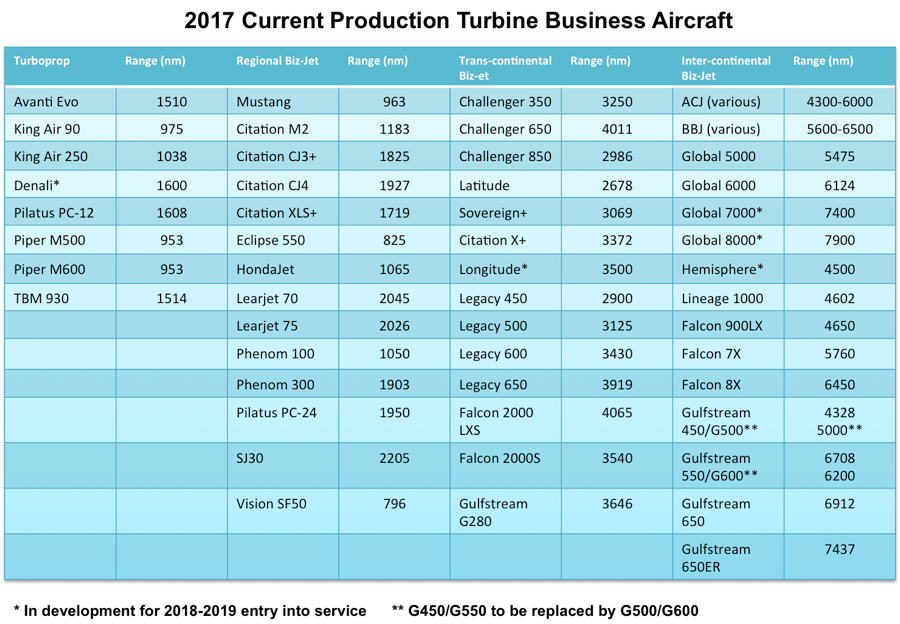
We know some models are more popular than others, but for the sake of general argument, can an OEM survive and profit on 17 units production per year per model?
Factor in to this the discounting of new aircraft that is currently in practice (2016-2017) and we can only conclude that OEMs are producing too many aircraft and probably too many models for existing demand.
New models coming into the market in the next few years (by 2019 there will be a net addition of at least three new models in the mix) will only mask the underlying problem as the delivery pipeline builds. Will there be customers for the new models, will there a market for the trade-ins, will the new models simply encourage continued discounting to move them out of the factory?
The solution, though one that would be brave for any OEM to embrace, would be to reduce production and the number of models to a profitable level until the market demands more. That higher demand is not likely to happen until production comes into balance with the current overhang of good used aircraft.
Marketers need to fully understand the dynamic of used vs. new so they can help the C-Suite plan appropriately for the market as it is and not as we wish it to be.
Chapter 5 – A Major Shift in Demand (And a few other things that might keep you up at night)
As a marketer, your first questions are usually “who, and where, is the customer”? And then of course, what do they want? It has become clear that in a global economy, the customer for business jets is everywhere. And as far as what do they want – they want bigger jets that can fly farther. Let’s look at these two issues – the market on a global basis, and the shift in demand from smaller to larger jets.
The shift in global demand, and in the shift from smaller to larger jets, are related
Industry analyst Richard Aboulafia of the Teal Group, has referred to a bifurcation of the business jet market after the 2008-09 recession. He ably demonstrated that while the small and midsize jet markets took a tremendous beating during the recession, the builders of large business jets (those over $20M in value) never looked back. The demand for Gulfstream, Global, and Falcon jets hardly skipped a beat.
Very true, but rather than looking at the value (or acquisition price) of the aircraft we prefer to look at business jets in terms of their range (an indication of function), as we did in the previous chapter, and again we’ll classify business jets here as regional, trans-continental or inter-continental aircraft.
Let’s look at business Jet deliveries 2003 through 2016: pre-Recession vs. post-Recession, first in terms of units sold and then on a market share basis.
Units: The total market is flat, with an average annual sale of about 690 business jets in the six-year period of 2003-2008, and about 678 units per year for 2009-2016:
| 2003-08 (6 yrs.) | 2009-16 (8 yrs.) | Δ | |
| Regional Jets | 1999 | 2260 | 261 |
| Trans-continental Jets | 1288 | 1392 | 104 |
| Inter-continental Jets | 855 | 1775 | 920 |
| Total units | 4142 | 5427 | |
| Avg. units/year | 690.3 | 678.4 |
Market share basis: On a share basis, however, the market has clearly shifted in favor of larger jets (Inter-continental Jets) capable of long-haul ranges (4,000nm and greater):
| 2003-08 | 2009-16 | Δ | |
| Regional Jets | 48.3% | 41.6% | (6.7) |
| Trans-continental Jets | 31.1 | 25.6 | (5.5) |
| Inter-continental Jets | 20.6 | 32.7 | 12.1 |
| Total units | 4142 | 5427 |
During the Great Recession of 2008-2009, there was much ado about the shift in the world market. Indeed, new business jet deliveries became more heavily weighted to outside North America to a point where the rest of the world was taking just over half of all new deliveries: the Middle East, Brazil, Russia, India and China figured heavily in this shift.
What do these areas of the world have in common – great distances between major cities, which translates to a demand for range and comfort, i.e. larger jets with more room for fuel and larger cabins for more comfort. The wealth of the buyers also plays into this scenario – Russian oil billionaires, Middle East oil billionaires, Chinese manufacturing billionaires, Indian manufacturing billionaires – well you get the idea. Yes, billionaires tend to like big things both to denote their success and, in this case, the practicality of a comfortable long-range machine.
The emergence of this global market was also helped by favorable foreign exchange rates driven by a weak US dollar in the early 21st century. Turbine powered aircraft, no matter where manufactured, are priced in U.S. dollars. Consequently, a weak dollar makes aircraft products more affordable outside the USA. A weak dollar in the first few years after the Great Recession enabled buyers in the Middle East, Africa, Asia and Latin America to leverage this to advantage. Conversely, a strong dollar along with other market factors can make aircraft purchase less attractive overseas.
The same logic applies to the used aircraft market. We saw significant portions of the 1-10-year-old business jet inventory migrate offshore during the Great Recession and shortly thereafter. The non-U.S. customer could afford to pay more and outbid U.S. buyers thanks to exchange rates that in some places showed a 30% differential. With a strengthening of the U.S. dollar, sales migration slowed offshore. In fact, some used aircraft that migrated offshore immediately after the Great Recession are now returning to the USA. Obviously, this is not the only reason for the market behavior, but it is a factor for marketers to consider.
By 2016, things had settled down and once again North America, specifically the USA, was taking more than 50% of new production.
Why? The BRICs (Brazil-Russia-India-China) are still around but as of this writing most of their economies are not performing very well. As one industry analyst recently described the BRICs: now there is only C, but much of that (Chinese) pipeline has been filled for now.
As marketers, we need to be realistic and avoid being faked-out by short-term conditions. We try to plan for the longer term. While the USA and Europe were entering recession in 2008-2009, the BRICs were prospering – and a good thing they were for business aviation. Emerging strength in Brazil, Russia and India helped fuel demand for aviation services while an extraordinary economic growth cycle in China combined with a new government focus on opening up aviation created robust demand for business aviation products.
Cycles – if the aviation is anything, it’s about cycles. And as marketers we need to watch them carefully.
Meanwhile, back in Wichita . . .
The vast majority of the world’s small and midsize jets are built in Wichita, Kansas. But not big jets. Those are built elsewhere. As a result the Great Recession was devastating to Wichita – its economy, employment, and production. As often happens during downturns, mergers and consolidations were some of the outcomes. Cessna’s parent company Textron answered the challenge with the purchase of long-time rival Beechcraft (and immediately closed production of Beech’s Premier and Hawker lines, casualties it would seem of the sales doldrums for Regional (Premier) and Trans-continental (Hawker) aircraft.
The new Textron Aviation that emerged implemented a change in strategy: strengthen itself through diversity across product lines and expand into larger airframes at its Cessna Aircraft brand. Finally, Wichita decided to join the big jet battle with its coming-soon Longitude and Hemisphere models.
But these new Textron/Cessna aircraft will be competing to some degree (for the first time) with Falcon and Gulfstream products; as we argued in the last chapter (“Too many models?”), however, will these “newbie” products be able to compete against some of the strongest brands in business aviation in a (new) product category, Inter-continental Jets?
That remains to be seen, but of course don’t write off “little jets” yet. There is still demand for what they do and a need to replace aging models. That is a niche that Textron has long dominated, and must not let itself be distracted here by its foray into the larger jet competition.
Other things to worry about at night . . .
As though marketers don’t have enough challenges, we cannot ignore extraneous factors such as government regulations and what may be on the horizon. Certainly the talk of environmental impact of aircraft will not go away. While the EU’s failed attempt at instituting a Carbon Footprint emissions tax illustrated the challenge of universally mandating a regional rule to a global market, the issue of environmental impact of aircraft and what the industry can do about it remains. Marketers need to consider the value of this element in their messaging. Engine OEMs are addressing the issue with “green” new designs, as are airframe designers. Marketers should leverage whatever good news they can glean from this.
Airspace user fees, so common outside the USA, remain a concern in the world’s largest business aviation market. While no airspace user fees exist as of this writing for the U.S., we think fees will likely become a reality sooner or later. After 2020, the FAA will have a perfect toll tag in place in the form of ADS-B equipment required for virtually all aircraft. While user fees will not close down business aviation, fees could certainly add another impediment to market growth and marketing messaging.
Part I Summary: Heightened Adversity through Structural Change
In this first section we looked at key changes we’ve seen in the business aviation market since the Great Recession that we submit are both important and of such staying power that they will continue to impact the market for at least the next five to ten years.
On a practical level, how do such changes impact the industry’s key stakeholders: OEMs, MRO companies, FBO operators and individuals who work in the industry?
OEMs:
- There is a widening gap between new aircraft price and used aircraft price. Often the difference in performance, comfort, and capability of new vs. used is too small to justify the difference in price. This calls for OEMs to approach the market with greater precision in product development, product mix and pricing policy to ensure “new” offerings can justify a higher price.
- The importance of value driven product differentiation has never been greater. How does a seller justify the price gap between a $21 million 2008 Gulfstream G450 and a new G450 at $43 million? The new product must offer more of everything, e.g., lower operating costs, more environmentally friendly engines, significantly upgraded systems and avionics, customized after-market services, etc. Perhaps fewer models are needed, but place higher value in those offered.
- OEMs are looking at relatively flat sales for the rest of the decade. The flurry of new product designs currently entering the market is an attempt to create market excitement and a desire to refresh the fleet as it should. But considering the competition not only from other OEMs but also the used business aircraft market, marketers have to carefully craft their messaging to differentiate their new products from the old. As we’ve mentioned before, pricing has become a dominant factor in any sale due to the wide gap between pricing of new and relatively “young” inventory. So building on the operating cost improvements, technology updates and the support should be major areas of focus.
- We see serious issues confronting go-forward strategies: How many products do we offer – we think there are too many models currently being offered right now – in this relatively small but demanding market called business aviation? How do we differentiate our products? How do we price new products to compete with our own earlier models as well as those of our competitors? How do we cover the global market with sales and support while maintaining a consistent level of service and create brand loyalty?
MRO companies:
- There is increased opportunity for retrofit and upgrades of key equipment (avionics, interiors, paint, engines) to keep older aircraft operationally competitive. Cost control of these upgrades is critical and must be kept within an economically justifiable range lest they push the customer toward buying new.
- Lower utilization means less demand for MRO. This also implies that legacy products may be around for an even longer time than anticipated. While it is difficult for brand loyalty to overcome a lower competitive price quote, for those who can demonstrate that their brand really means value – in service, in support, in reliability – there remain avenues that can help boost margins.
- How do MROs compete with OEMs? Can they make enough margin on legacy products and aftermarket services to compete in their space and yet distance themselves from new products offered by OEMs. How do they market their products in an industry that increasingly sees them as a commodity where price is the key driver?
FBO companies:
- Newer aircraft are more efficient, longer range. Consequently location, pricing and customer brand loyalty are critical.
- Higher aircraft pricing is not a direct concern to FBO operators, but higher aircraft inventories can mean less flight activity, and consequently fewer gallons pumped, fewer service opportunities. A focus on loyalty programs, co-op programs with other service companies, and brand awareness are some key considerations.
- Slow growth in flight activity and lower average utilization makes it essential that customers receive an excellent service experience at every touch supported by such promotions as incentivizing operators through loyalty, rewards, and frequent user programs (volume discounts). Obviously the large chains have an advantage in this regard, but single location operators can offer the same high level of service along with a personalized approach that may be the key to customer retention.
- How do FBOs keep captive customers happy (those based with an FBO or who have no option but to use that FBO’s service) while attracting new customers to try our service? What role does brand, loyalty, and service play versus pure pricing?
Industry workers:
- Must re-evaluate where the opportunities will lie and what skills will be in demand.
- High inventories and low used aircraft prices mean pricing pressure on suppliers. Value added services and partnering with key vendors are potential means to out-market the competition.
- The slow recovery in sales and flight cycles is incentive to deliver best performance during every customer contact knowing that customers are so difficult to recover once lost.
- How can we leverage marketing tools to support our customers?
Finally, here are some critical questions that everyone in the industry who has anything to do with marketing should ask themselves and their team members
Simple starting point: ask yourself if your business aviation marketing strategy has been revisited to accommodate this new era. Whether you are selling new or used aircraft and engines, aftermarket services or FBO services, does your marketing plan consider:
- The availability of credit and the terms for obtaining credit. How much down payment will my customers need to provide?
- Has my customer base changed? Do I still know who they are?
- The new level of surplus aircraft – is my customer better served by a “used” aircraft that provides the same or nearly the same levels of performance, comfort and capability as a new aircraft?
- Am I sufficiently differentiating my new products to justify the pricing gap compared with an older aircraft?
- With used aircraft prices still fluctuating, how do I cope with buyers who know it is a buyer’s market?
- Does my sales forecast truly accept that lower levels of delivery are a reality for the next three, five and even ten years?
- Average aircraft utilization is now lower, so how does that affect my marketing planning?
- If smaller jets are less popular, what am I doing to attract more large jet business?
- Are we offering too many products making it hard to differentiate one from another?
- What impact will exchange rates have on my business: this year, next year?
- Am I expanding globally? Should I be expanding globally?
These are just some of the issues that might impact the strategy of your business; there are certainly many more specific to your particular product and service offerings.
Next – Part II: Today’s Business Aviation Market – Rapid and Significant Change in the B2B Marketing Process